
Customizing the Abaqus Legend Values
- Aug 9, 2025
- 2 min read
Updated: Dec 3, 2025

Clear visualization of simulation results is key to understanding and communicating insights. In Abaqus, the legend is a vital part of the postprocessing display, showing stress or other field quantities. Precise legend scaling isn’t just cosmetic—it helps maintain numerical clarity during postprocessing.

The Challenge: Customizing Legend Values in Abaqus
By default, Abaqus displays stress values in units like Pascals (Pa). However, depending on the nature of your analysis, you may prefer to show results in other units, such as MegaPascals (MPa), or in normalized form. But how can you adjust the legend to reflect these variations?
Let’s look at two common cases:
Displaying stress values in MPa
When running a stress analysis, results are typically shown in Pascals. For clarity, especially when dealing with large values, it may be more practical to display stress in MegaPascals.
To do this, divide the stress values by 1e6 (since 1 MPa = 1,000,000 Pa).
This produces a cleaner, more readable legend with smaller and more manageable numbers.

Contour plot with modified stress field for improved clarity using unit conversion.
Displaying normalized stress values
In some analyses, it's more insightful to visualize stress relative to the maximum value in the model.
Normalized stress = σ / σ<sub>max</sub>, resulting in a dimensionless field.
This can help identify critical areas or stress trends more effectively, especially when comparing across frames or steps.

Visualization of stress results using a customized field in the Abaqus Viewer.
The Solution: Visualizing Abaqus Legends with Custom Scales
Abaqus offers flexibility in how results are displayed, but customizing the legend for unit conversion or normalization requires a few simple steps:
Open your simulation model in the Visualization module.
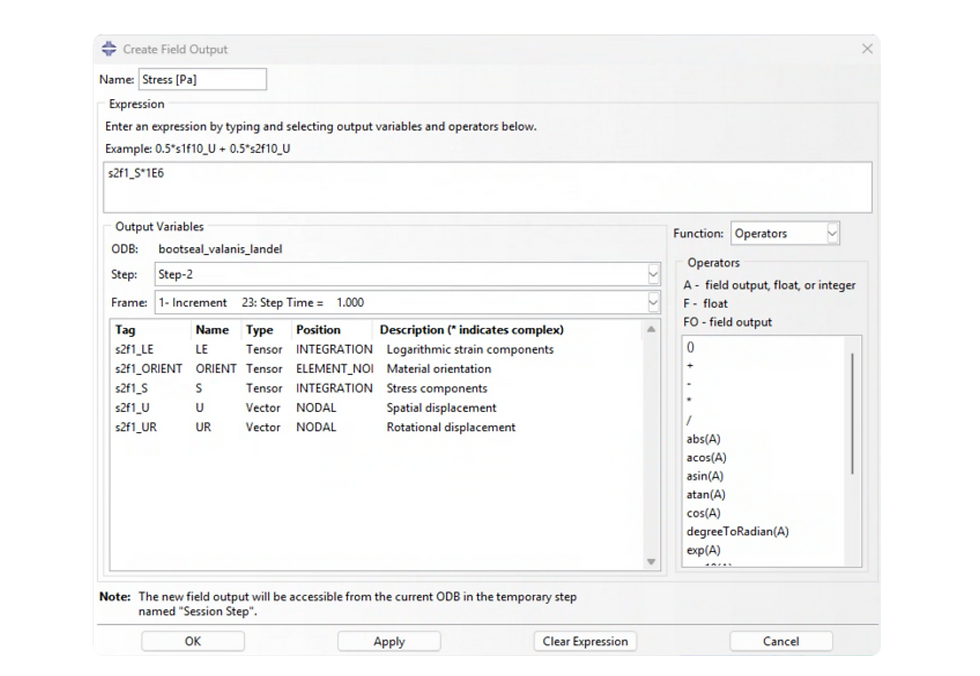
Create a new field output
Go to Result → Field Output → Create
Select Derived Field Output from Fields
Apply your formula (e.g., divide by 1e6 or normalize by the max stress).
Select Step/Frame
Go to Result → Step/Frame…
Choose the appropriate session step and frame.
Assign the custom field
In the contour display, select your newly created field.
Adjust the legend format or value range as needed.

Whether you're sharing results with a technical stakeholder or presenting to non-experts, customizing the legend ensures your simulations are easy to understand. Normalized plots help emphasize trends and distribution, while adjusted units avoid unnecessary complexity from large numerical values.
Need Help Customizing Your Abaqus Legend?
Whether you want cleaner units or normalized results, customizing the legend in Abaqus improves your postprocessing workflow. If you need support with setup or unit conversions, fill out our contact form or email us at marketing@4realsim.com. We will help you fine-tune your visualization for clarity and impact.


Comments