27 Feb Streamlined Workflow for EV Battery System Development
Accelerating battery conceptual design, component scaling, and performance trade-off analysis through an integrated 1D and 3D approach.
Electric vehicle market challenge</h2?
The electric vehicle (EV) market poses unique challenges for battery system development, notably the proliferation of battery and cooling designs coupled with limited test data. This necessitates a swift, precise, and automated calibration workflow to expedite battery conceptualization, component scaling, and performance analysis. Furthermore, the pressure to reduce development time and costs while adopting a holistic design approach adds to the complexity.
Battery system development calibration workflow
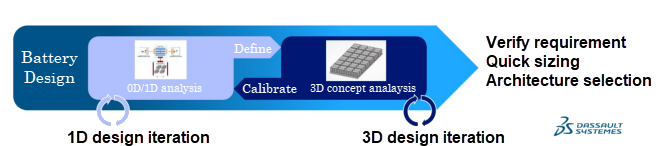
The aim of this article is to introduce a calibration workflow that achieves rapid, accurate, and automated analysis for battery system development. By integrating 1D and 3D modeling, users can efficiently evaluate various designs, perform comprehensive thermal system analyses, and refine designs iteratively. This integrated approach is depicted in the figure below, illustrating the iterative process between 3D simulation and 1D calibration.
Battery cell-level correlation
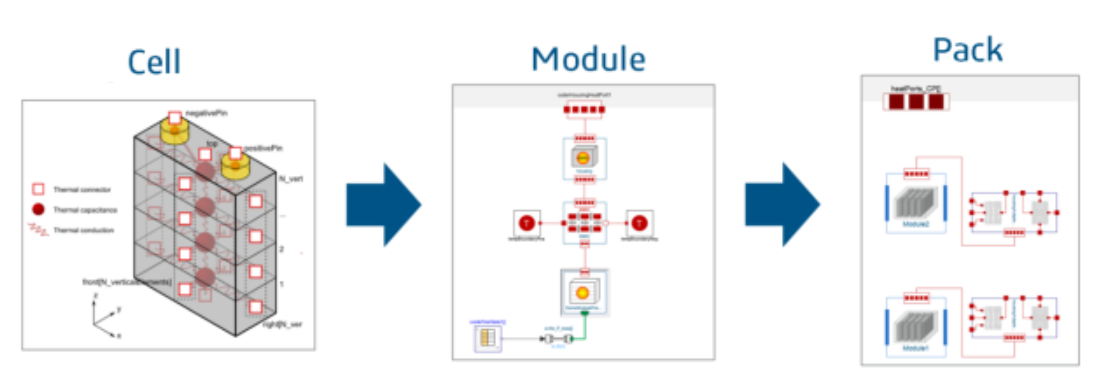
Initially, the workflow begins with a battery cell-level correlation. A 3D parametric model is created and correlated with a 1D battery cell parametric model from the Dymola Modelica library. This correlation extends to the battery module/pack level, where a similar approach is employed for both the battery module and cold plate system.
The Dymola Modelica library provides extensive parameters for modeling thermal behavior, allowing users to accurately represent battery cells, modules, and cooling systems. This includes discretizing thermal capacity and parameterizing thermal properties based on geometry and material data. Meanwhile, on the battery module level, the individual cell behavior is maintained, but now thermal interactions between the cells and environment is accounted for as well. At the battery pack level, one reuses battery module models and also considers additional housing and interfaces. This can be seen in the figure below.
Cooling plate and its channels
Moving on, the liquid cooling cold plate model offers variable flow geometry with vectorized fluid channel for the independent modelling of parallel fluid channels and solid wall element discretization. It also enables a 2D wall dynamic thermal capacitance grid with 3D thermal inertia of the heat exchanger core to be accounted for. Overall, the parameterization of the cold plate correlates to the actual design data in terms of dimensions, material properties, and number of channels.
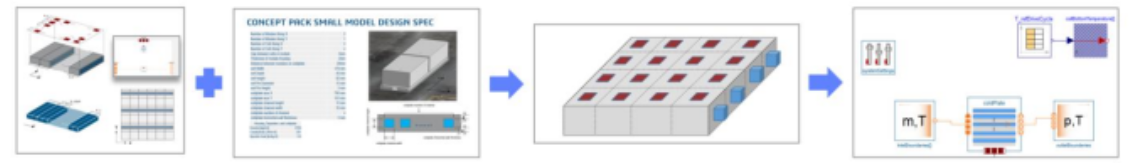
3D parametric battery system and cooling model
Moving to the 3D representation, a parametric model is utilized for battery system and cooling geometry. This model incorporates continuous parameters for various components and discrete parameters for cell/module configurations, ensuring flexibility and automation in the workflow.
For computational fluid dynamics (CFD) and conjugate heat transfer (CHT) analyses, the 3DEXPERIENCE platform’s FMK Reynolds-Averaged Navier-Stokes (RANS) solver is employed. Automatic contact detection and fluid domain sealing enhance efficiency and accuracy.
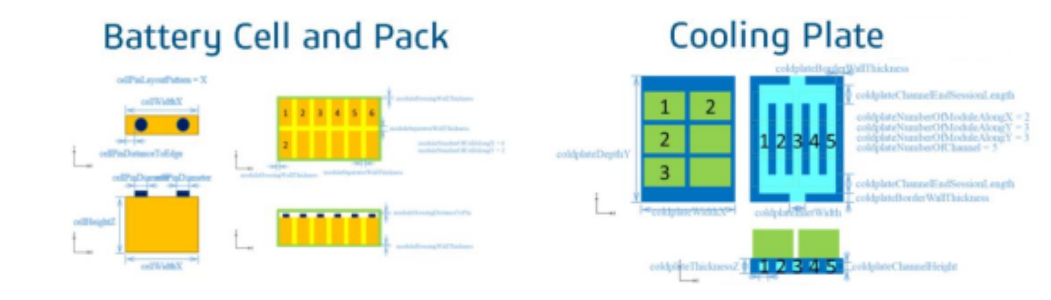
The parameterized battery cell and pack, and cooling plate geometries are shown below.
Automated correlation methodology
The correlation methodology aims to match the behavior of the 1D model with the reference 3D model. This involves separate correlation of solid and fluid domains, considering the non-linear nature of fluid convection and the linear behavior of solid conduction. For fluid convection, one therefore correlates flow dependent thermal convection behavior. With solid conduction, a two-step process is adopted: steady-state results are correlated by tuning the conduction path, while transient results are correlated by tuning the thermal mass distribution. The correlation process is automated using Dymola simulations and Python optimization routines.
EV Battery System validation
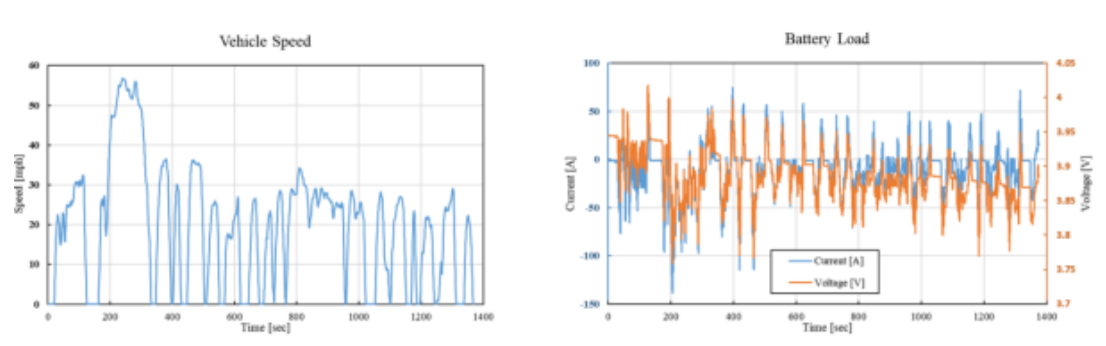
To validate the workflow, an EV duty cycle is simulated using data from the EPA Urban Dynamometer Driving Schedule (UDDS). Comparison between 3D and 0D/1D results demonstrates good accuracy, even under dynamic load conditions.
The associated vehicle speed and battery load is depicted below.
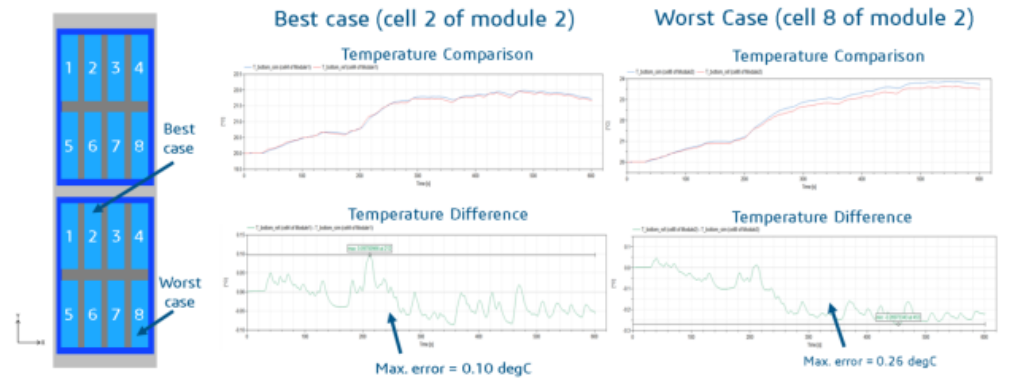
For a battery pack consisting of two battery modules each with eight battery cells, the best and worst temperature comparison between the 3D and 0D/1D result is shown below. At best, the battery temperature delta is as low as 0.10°C, while in the worst case the battery temperature delta is as high as 0.26°C.
EV Battery System conclusion
In conclusion, the integrated 0D/1D and 3D correlation workflow offers a streamlined approach to EV battery system development. The accuracy achieved, particularly under realistic load cycles, underscores the efficacy of this approach for future development endeavors.
This blog post is based on the Dassault Systemes blog post: https://blog.3ds.com/brands/simulia/integrated-1d-3d-workflow-ev-battery-system-development/
Contact us if you would like to hear more about the described workflow.

